
Market Analysis
The American Home Just Turned 42.
Build the Business That Serves It.
Rates wobble, starts fall, buyers stall. Meanwhile the housing stock keeps aging on a schedule no Fed meeting can touch. The median American home is now 42 years old, and homeowners spent $670 billion on theirs last year. Here’s the data, and here’s how to build for it.
Growth Strategy
● Active Tracking
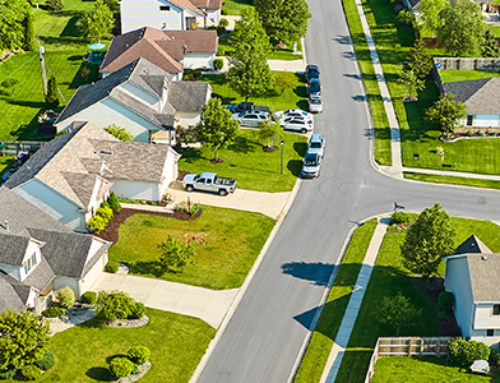
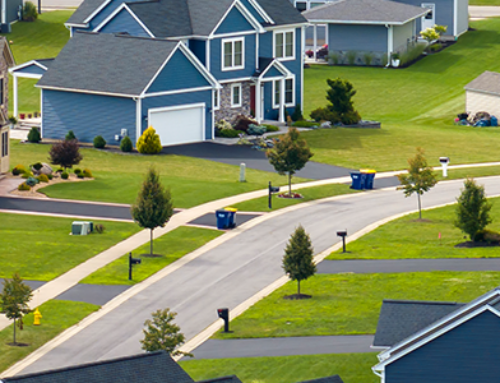
Drive any block in your market and count the roofs past 20 years old. Now the panels, the furnaces, the water heaters, the original windows behind them. None of those systems checks the 10-year Treasury before failing. They fail on a schedule, and the schedule is getting crowded. The median owner-occupied home hit 42 years old in the 2024 American Community Survey, up from 31 in 2005 (NAHB, March 2026).
The defense season gets the headlines right now, and the last two briefings in this series were defense for good reason. This one is offense.
The aging stock is the one order book in housing that grows every year nobody builds.
Fifteen years of under-building didn’t just create a shortage of new homes. It built a replacement economy, and it’s parked on every street you drive.
Homes Got 11 Years Older in Two Decades. Their Systems Noticed.
The composition shift is stark. Homes built within the previous 14 years made up 18% of the owner-occupied stock in 2014. By 2024, that share had fallen to 13% (NAHB, March 2026). Meanwhile homes at least 45 years old climbed from 39% to 47% of the stock.
Nearly half the houses in America are older than most of the people reading this.
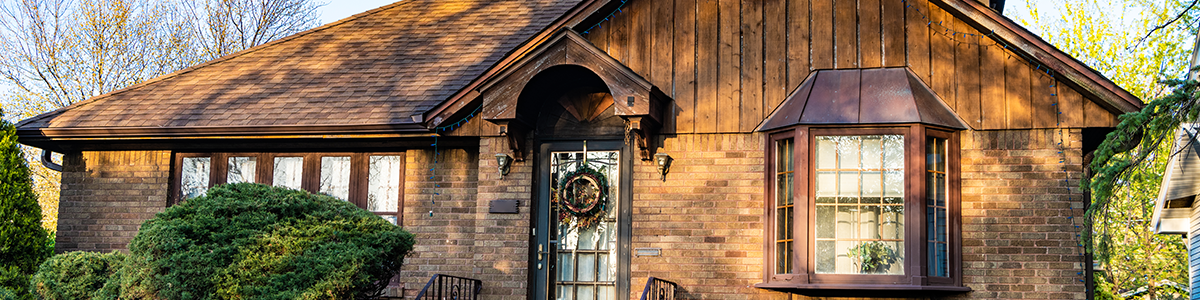
A 45-year-old house is a specific list of work. Original electrical serving triple the loads it was designed for. Plumbing at end of life. Envelopes and windows from an era of cheap energy. Kitchens and baths two owners out of date. That work doesn’t wait for a rate cut, and much of it can’t.
Map your service area by housing age this month using the Census Bureau’s ACS data, down to the tract. A neighborhood platted in 1978 is panel-upgrade and repipe territory, and you can name it street by street before your competitors think to look.
$670 Billion, and the Biggest Spenders Have the Most Equity
This is not theoretical demand. Homeowners spent roughly $670 billion on remodeling in 2024, with about 20 million households, 23% of all owner-occupants, reporting a project (NAHB analysis of the Consumer Expenditure Survey, May 2026). Baby Boomers alone accounted for around $254 billion of it, about 38% of the total, with Gen X close behind at over $207 billion.
Look at who that is. Equity-rich owners, aging in place, inside aging homes. Two curves converging on one customer. And NAHB projects the market grows 3% in real terms this year and 2% more in 2027 (NAHB, February 2026). The same February analysis names the perennial top project types: baths, kitchens, whole-house remodels. The demand is mapped, funded, and forecast to grow.
This is demand you schedule. Most of housing right now is demand you chase. Build toward the first kind.
Build one named offer for this buyer within 60 days: an aging-in-place package, a system-replacement tier, or a whole-house assessment with a fixed price. A generalist pitch wins none of this market, because the 65-year-old with a 1975 house isn’t shopping for “we do everything.” She’s shopping for someone who’s clearly done her house before.
SBGP reviews your operations and internal processes and builds a step-by-step 12-month plan around them, so your new service line runs as a documented system instead of one more thing living in the owner’s head.
One Page Beats a Bigger Ad Budget
Finding this demand is the easy half. Being structured to say yes to it, profitably and repeatedly, is the whole game. The difference between chasing this market and owning a piece of it is one page: the job documented from first site visit through final invoice, priced from your break-even math, and run by somebody who isn’t the owner.
That page is what makes the line real. It’s what lets a lead carpenter run job four while you sell job nine. It’s what keeps margin consistent when volume climbs. And someday it’s part of what makes the company sellable, because a service line that lives in the owner’s head walks out the door with him.
Document one repeatable job type on one page this month. Run the next job off it. Fix what the page got wrong, then hand it to someone else for the job after that.
The Order Book, Segment by Segment
Seed a remodel and addition arm from your own warranty files and closed-job list. Those records tell you exactly which homes you built 15 to 25 years ago and who’s still in them, and no competitor has that list.
One PM, one documented job type, and prove the margin before you staff it.
Productize the aging-in-place tier: fixed scope, fixed price band, aimed at the 55-to-75-year-old owner in a 45-year-old house.
Then push the numbers down. Your lead carpenter or PM brings gross profit per job to a weekly review, so the line grows without growing your hours.
Sell the replacement schedule instead of waiting on the breakdown call. A 1980 neighborhood is full of panels, furnaces, and water heaters aging out on a calendar you can market to.
Stack maintenance agreements next to project work: that book is revenue that shows up whether or not the phone rings in a slow quarter.
Rates Are a Season. The Housing Stock Is a Trend.
Defense wins the next two quarters, and you should play it. This wins the next five years. The stock gets a year older every year, the equity to fix it is already in place, and the spending is forecast to grow through 2027. What it rewards is structure over hustle: a mapped market, a named offer, a documented page, and somebody besides the owner running it.
The 42-year-old housing stock isn’t a maintenance problem. It’s the most predictable order book in America.
A BPA from SBGP is a 30+ page, step-by-step 12-month plan built specifically around your operation. SBGP analyzes your financials, your marketing and sales process, your hiring and team communication structure, and your strategic positioning, and delivers a personalized, time-based roadmap. If you want a revenue stream that runs on the age of the housing stock instead of the mortgage rate, the Operations and Processes sections of your BPA turn it into a documented, repeatable service line. DISC Profile and Motivational Assessments for you and up to five members of your management team are included.
✓ Operations
✓ Finance & Tracking
✓ People & Role Clarity
Sources: NAHB Eye on Housing analysis of 2024 American Community Survey data (March 2026) · NAHB analysis of the Consumer Expenditure Survey (May 2026) · NAHB remodeling outlook (February 2026)
Market Analysis
SBGP